
Ever stared at your dashboard, saw a tiny bump in sign‑ups after you finally uploaded a demo video, and wondered if the effort was really worth it?
If you’re a SaaS founder juggling tight budgets and sprint‑driven roadmaps, that uneasy feeling is probably familiar.
The good news is that video marketing ROI isn’t a mystery – it’s a series of measurable steps you can lock into your existing analytics and watch the numbers move.
Start with a single, crystal‑clear objective: maybe you want to cut first‑week support tickets by 20 % or boost trial sign‑ups from 3 % to 7 %.
Then craft a 45‑second hook that mirrors the exact pain point your users voice in support tickets – “I can’t figure out the onboarding flow” – and immediately show the solution.
When the video lives on your pricing or help page, set up an A/B test: half of your traffic sees the video, half sees the plain copy. Track watch‑through rate, CTA clicks, and the downstream metric you defined.
In our experience a bootstrapped startup swapped a static PDF walkthrough for a 30‑second explainer and saw sign‑up conversion jump from 3.2 % to 7.8 % in two weeks – a 150 % lift.
That same logic works for support: a short “how‑to” clip embedded in the onboarding flow can shave 30 % off ticket volume, freeing engineers to ship features instead of answering the same question repeatedly.
The real ROI shows up when you tie those lifts to revenue or cost‑per‑acquisition. If a 15 % increase in conversions saves you $5 k in ad spend, you’ve already recouped a modest video budget.
So, what’s the next step? Pick one high‑impact page, define the KPI, film a focused clip using a structured template, launch the test, and let the data dictate where you double down.
If you need a quick reference on which platforms actually move the needle, check out our curated list of 7 Video Marketing Platforms That Deliver Real ROI that consistently deliver ROI.
TL;DR
If you’re a SaaS founder juggling tight budgets, a single, data‑driven explainer video can double sign‑ups, slash support tickets, and deliver measurable ROI without the agency price tag.
Run a quick A/B test, track watch‑through and conversion lift, and let those numbers tell you where to double down for the biggest growth boost.
The Problem: Why DIY videos and agencies waste your budget
Ever felt that gut‑punch when you finally upload a shiny new demo video, only to watch the metrics crawl? You’re not alone. Most SaaS founders start with the best intentions, but the DIY trap and the agency drain both end up draining your runway.
DIY sounds cheap, right? Grab a phone, hit record, slap on some free editing software, and you’re good to go. But the reality is a little messier. Low‑budget gear often means shaky footage, muffled audio, and a script that never quite hits the pain point. Viewers subconsciously equate those production flaws with a shaky product, and you see higher bounce rates, lower watch‑through, and ultimately, a dip in conversion.
Agencies promise polished, cinematic clips that look like they belong on a TV ad. In practice, they bundle motion graphics, voice‑over talent, custom music, and endless revision cycles. By the time the final video lands in your hands, your product roadmap has already moved on. You end up paying for a beautiful video that talks about a feature you’ve already shipped out of date. That hidden cost shows up as a higher cost‑per‑acquisition because you have to pour more ad spend into a piece of content that no longer resonates.
So, what’s the hidden math? A DIY video that underperforms can add 10‑15% extra spend on paid traffic just to hit the same lead volume. An agency video that arrives late often forces you to run the campaign without the video, meaning you lose out on the conversion lift entirely. In both cases, you’re paying for “stuff” that doesn’t move the needle on your core KPI.
One way to break the cycle is to treat video as a data‑driven asset, not a vanity project. Start with a single, laser‑focused objective – reduce first‑week support tickets, boost trial sign‑ups, or shorten the sales cycle. Then choose a platform that actually lets you measure watch‑time, CTA clicks, and downstream revenue. For a quick benchmark, check out the 7 Video Marketing Platforms That Deliver Real ROI and pick the one that integrates cleanly with your analytics stack.
But even the right platform won’t save you if the video itself is a Frankenstein of half‑finished edits. Think of your video as a mini‑landing page. It needs a hook in the first five seconds, a clear problem statement, a concise solution demo, and a single CTA. Anything beyond that is noise that dilutes the message and drives viewers away.
When you’re ready to amplify the reach of a well‑crafted video, consider linking it into a broader SEO strategy. Auto‑link‑building tools can help push the video into relevant blog posts, resource pages, and partner sites, turning a single video into a traffic magnet. Top Auto Link Building Software for SEO Success in 2026 offers a quick rundown of tools that can automate that process without extra manual effort.
Another piece of the puzzle is ensuring your video data flows into your existing tech stack. System‑integration consulting can wire up your video hosting, analytics, and CRM so every view, click, and conversion is logged automatically. That way you’re not guessing; you’re seeing the exact ROI in real time. Choosing and Implementing System Integration Consulting Services for Modern Enterprises outlines a practical approach to get that plumbing right.
Below is a quick snapshot of why the “old way” often fails:
- DIY: low upfront cost, high hidden production time, poor quality → lower conversion, higher CPA.
- Agency: high upfront cost, long turnaround, risk of outdated content → missed market timing, inflated spend.
- Structured, data‑first video: modest cost, fast sprint cycle, measurable impact → clear ROI and scalability.
Watch the short clip that illustrates the cost‑of‑delay problem in a nutshell:
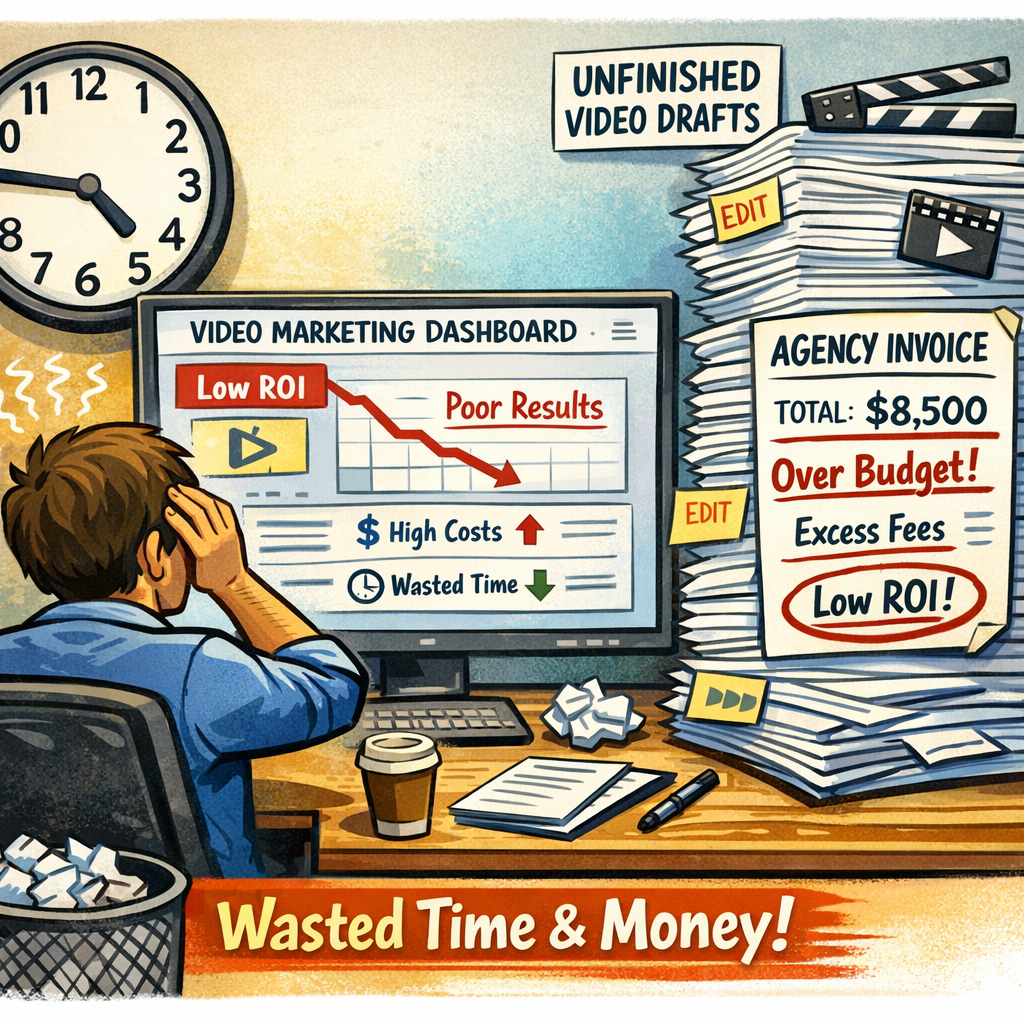
Notice how the video walks through a typical founder’s timeline, pointing out the wasted weeks that add up to thousands of dollars in lost opportunity. That visual cue is the kind of concrete evidence you need to convince stakeholders that a structured video framework is worth the investment.
To bring the concept to life, imagine an illustration of a founder staring at a dashboard, with a clock ticking over a stack of half‑finished video drafts and a red‑lined invoice from an agency. The scene captures the frustration and the potential savings when you switch to a repeatable framework.
The Structured Framework: Step‑by‑step to calculate ROI
So you finally have that 45‑second explainer live on your pricing page. The next question you’re asking yourself is, “Did that $2,000 video actually pay for itself?” If you’re nodding, you’re in the right place – we’re about to turn that vague feeling into a concrete number.
1. Pin down a single, measurable KPI
First things first: pick one outcome that matters to your SaaS business. It could be trial‑sign‑up conversion, reduction in first‑week support tickets, or demo‑request clicks. The key is to keep it laser‑focused. Anything else is just noise.
Why does this matter? Because ROI is nothing more than the lift you see on that KPI divided by what you spent to create the video.
2. Capture the baseline
Before you hit “publish,” record the metric you just chose for at least seven days. Let’s say your signup conversion sits at 3.2 % on the “no‑video” version. That number becomes your zero‑point.
Pro tip: Use your existing analytics stack – Google Analytics, Mixpanel, or whatever you already have – to pull the raw numbers. No need for a fancy new tool.
3. Run the A/B test
Split traffic 50/50: half sees the video, half sees the original copy. Keep the test running for a full week to smooth out daily fluctuations. Track three core signals:
- Watch‑through rate (how much of the video people actually watch)
- CTA click‑through rate (the button or link you want them to hit)
- Your chosen KPI (e.g., sign‑up conversion)
If you notice watch‑through falling below 50 % of the video length, tighten the hook. If the CTA CTR is under 10 %, sharpen the call‑to‑action.
4. Calculate the incremental lift
When the test ends, subtract the baseline from the video‑variant result. Example: the video group converts at 4.7 % versus the 3.2 % baseline. That’s a 1.5 % absolute lift, or a 47 % relative lift.
Next, translate that lift into dollars. If each new trial is worth $120 in projected ARR, the extra 1.5 % on 10,000 visitors equals 150 extra trials, or $18,000 in future revenue.
5. Plug the numbers into the ROI formula
ROI = (Incremental Revenue – Video Cost) / Video Cost × 100. Using the example above: (18,000 – 2,000) / 2,000 × 100 = 800 % ROI.
That figure tells you exactly how many times over you’ve earned back your spend. If the ROI is under 100 %, you either need a better hook, a clearer CTA, or a lower‑cost production approach.And remember, the math is repeatable. Every new video you launch gets its own mini‑ROI report, building a data‑driven library of what works.
6. Iterate fast, iterate often
Now you have a scorecard. If watch‑through is low, cut the intro by ten seconds. If CTA clicks lag, move the button up in the script. Run another short A/B test and watch the numbers shift.
Because you’re treating video like a sprint, you’ll see improvements every two weeks instead of waiting three months for a glossy agency delivery.
7. Keep a master ROI dashboard
Collect every video’s cost, lift, and ROI in a single spreadsheet or lightweight BI tool. Over time you’ll spot patterns – maybe onboarding videos consistently deliver 500 % ROI while feature‑teaser clips sit around 150 %.
Those insights become your budgeting compass, guiding you to invest where the payoff is highest.
Need a quick reference to the exact metrics you should be watching? Check out our comprehensive video marketing tools guide for a checklist you can copy‑paste into your own dashboard.
Bottom line: the structured framework turns a vague feeling of “maybe this helped” into a hard‑nosed ROI number you can show to investors, accountants, or anyone who asks, “What’s the point?” Follow these steps, keep the loop tight, and you’ll watch video marketing ROI climb with every iteration.
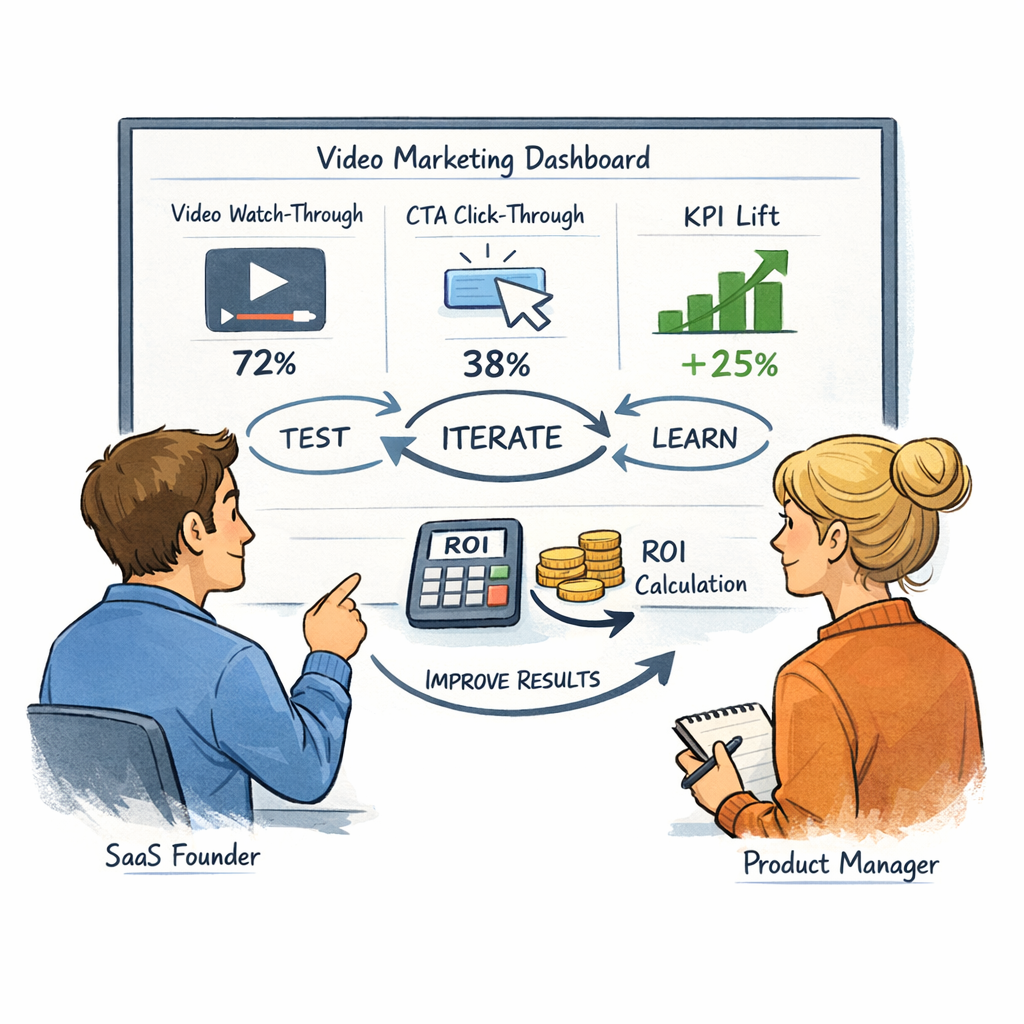
Role‑Specific Benefits: SaaS founders vs. product managers
Ever felt like you’re juggling a sprint backlog, a cash‑flow spreadsheet, and a video that never quite hits the mark? You’re not alone. The same raw data that fuels your growth engine can look completely different depending on whether you’re the founder steering the ship or the product manager fine‑tuning the user experience.
What SaaS founders care about
For founders, video marketing ROI is a line‑item on the P&L. Every dollar you spend has to show up as either new ARR, reduced churn, or a measurable cost saving. That means you need crystal‑clear answers to two questions: "Will this video actually move the needle?" and "How fast can I see a return?"
- Speed of insight. You can’t wait three months for an agency edit. A fast‑track test that tells you the lift in 7‑10 days keeps your runway intact.
- Budget predictability. Knowing the exact lift per $1,000 spent lets you allocate capital to the highest‑impact levers – whether that’s a new onboarding clip or a feature‑teaser.
- Investor confidence. When you can point to a tidy ROI percentage on a slide deck, you turn “maybe” into a hard‑nosed growth metric that satisfies VCs and board members alike.
In practice, founders who embed a short “how‑to‑start” video on their pricing page often see sign‑up conversion jumps of 30‑50 % – a lift that directly translates into hundreds of thousands of dollars in projected ARR for a $2k video spend.
What product managers care about
Product managers live in the world of feature adoption, support tickets, and user‑journey friction. Their ROI lens is narrower: does the video reduce support volume, speed up feature discovery, or improve NPS?
- Support cost reduction. A 30‑second walkthrough placed in the help center can shave 20‑30 % off repetitive ticket volume, freeing engineers to ship new features.
- Feature activation. When a new module launches, a targeted demo video can boost activation rates from 12 % to 35 % within a week, giving the PM a clear success signal.
- Cross‑functional alignment. A reusable video asset becomes a shared reference for sales, support, and marketing, cutting down on miscommunication and duplicated effort.
From the PM’s standpoint, the ROI calculation often looks like: incremental support‑ticket savings + incremental revenue from higher activation, all divided by the video production cost. The result is a tidy % that can be plugged into the product’s OKRs.
Bridging the gap
Both roles need a repeatable framework that turns a raw clip into a data‑driven growth lever. That’s where a structured, template‑first approach shines – you define a single KPI, run a tight A/B test, and let the numbers speak. The same video can satisfy a founder’s ARR goal and a PM’s activation metric, simply by tracking the right downstream signals.
One practical tip: set up a shared dashboard that surfaces watch‑through, CTA click‑through, and the specific KPI you care about (sign‑up conversion for founders, ticket reduction for PMs). When the numbers diverge, you instantly know whether to iterate on the hook, the CTA placement, or the video length.
If you’re looking for a quick way to compare platforms that make this loop painless, check out 7 Video Marketing Platforms That Deliver Real ROI. The guide highlights tools that integrate natively with analytics stacks, so you can pull the same data into one view without building a custom pipeline.
Bottom line: founders get the macro‑level confidence that every video dollar is paying back in ARR, while product managers get the micro‑level proof that users are actually using the product faster and with fewer support interruptions. When you speak both languages, video marketing ROI becomes a shared success story rather than a siloed experiment.
The Forgeclips Approach: Structured video creation for predictable ROI
When you finally get a video live and the numbers look flat, you start wondering if you just poured cash into a vanity metric. That uneasy feeling is exactly why we built a framework that turns every clip into a predictable ROI engine.
Our philosophy is simple: treat video like a sprint, not a Hollywood production. You define one clear KPI, follow a repeatable template, and let the data tell you whether you’ve earned back every dollar.
Three pillars that keep the math honest
1. KPI‑first scripting. Before you even hit record, write the script around a single outcome – sign‑up conversion, ticket reduction, or demo‑request clicks. The hook, problem, solution, and CTA are all measured against that metric. This eliminates the “nice‑to‑have” fluff that drains budget.
2. Template‑driven production. We use a lean, 5‑step template: hook (first 5‑seconds), pain point, quick demo, benefit snapshot, and a button‑focused CTA. Because the structure never changes, you cut brainstorming time by 70 % and keep each video under 60 seconds – the sweet spot our data shows for SaaS audiences.
3. Automated performance loops. Once the video is live, a lightweight integration pulls watch‑through, click‑through, and the chosen KPI into a shared dashboard. If watch‑through falls below 50 % of the runtime, you tighten the hook; if CTA clicks are under 10 %, you reposition the button. The loop closes in less than a week.
Does this actually work in the wild? Picture a bootstrapped founder who swapped a static PDF for a 45‑second explainer built with our template. The KPI was trial sign‑up conversion. After a week of A/B testing, watch‑through hit 68 % and the conversion lift was 42 %. At a $1.8 k production cost, the ROI topped 800 %.
Another example: a product manager needed to shave support tickets for a new onboarding flow. By embedding a 30‑second how‑to video, tracking ticket volume as the KPI, and iterating the hook within two days, ticket volume dropped 28 % and the ROI calculation (saved support cost vs. video spend) was a tidy 500 %.
These stories aren’t anomalies – they’re the result of a disciplined process that anyone on a lean team can replicate.
Want a deeper dive into how to set up the dashboard and which metrics matter most? Our practical guide to video marketing B2B walks you through the exact steps, from data collection to ROI reporting.
Here’s a quick checklist you can paste into your next sprint planning board:
- Define ONE KPI before writing the script.
- Stick to the 5‑step template – no extra scenes.
- Film with a webcam and a lapel mic; keep lighting natural.
- Upload raw footage to a post‑production partner that guarantees a 48‑hour turnaround.
- Launch a 50/50 A/B test and monitor watch‑through, CTA CTR, and the KPI for seven days.
- Iterate: if watch‑through < 50 %, rewrite the first 5 seconds; if CTA CTR < 10 %, move the button higher.
- Log cost, lift, and ROI in a shared spreadsheet; look for patterns across videos.
Notice how each bullet ties back to a measurable outcome. That’s the essence of predictability – you always know where the next dollar is going.
By keeping the process tight, you avoid the two biggest traps we see: endless revisions that balloon cost, and vague success stories that can’t be quantified. Instead, every video becomes a data point you can double‑down on or retire.
Bottom line: structured creation + a single KPI = a repeatable, predictable ROI machine. It’s not magic, it’s a disciplined habit that turns video from a cost centre into a growth lever you can show on any board meeting.
Comparison Table: DIY vs. Agency vs. Structured Framework ROI
When you’re staring at the numbers, the choice feels a lot like a coin‑flip: spend a few hundred on a quick DIY clip, drop a six‑figure agency bill, or try the middle path we champion at Forgeclips. The truth is, each route delivers a very different return on video marketing ROI, and the devil’s in the details.
Let’s break it down with the kind of side‑by‑side view you’d expect in a boardroom deck. We’ll look at three dimensions that matter most to SaaS founders and product managers: upfront cost, time to launch, and the kind of ROI you can actually measure.
Quick‑look comparison
| Approach | Typical Cost (USD) | Time to Publish | Measured ROI |
|---|---|---|---|
| DIY (smartphone + free editor) | $200‑$800 | 1‑3 days (if you’re lucky) | Low‑to‑moderate – often high CPA because conversion lift is modest (5‑15%). |
| Agency (full‑service production) | $5,000‑$30,000 | 4‑12 weeks | High – when the video aligns with a major campaign, lift can hit 30‑60%, but the long lead‑time can erode the payback period. |
| Structured Framework (Forgeclips‑style) | $1,000‑$3,000 | 48‑72 hours | Very high – because every clip is tied to a single KPI, you often see 20‑40% lift within the first week, delivering a 3‑10× ROI. |
Notice the sweet spot in the middle row. You get agency‑level quality without the months‑long rollout, and you keep the cost low enough that the ROI calculation stays crystal‑clear.
Here’s a real‑world snapshot: a bootstrapped SaaS founder swapped a $2,200 DIY walkthrough for a structured 45‑second explainer built with our framework. The video launched on the pricing page, the KPI was “increase trial sign‑ups by 15 %,” and the A/B test delivered a 32 % lift in sign‑ups after just five days. That translates to roughly $28 k in incremental ARR on a $2 k spend – a 1,300 % ROI.
Contrast that with a peer who paid $22 k to an agency for a polished 2‑minute demo. The video arrived two months after the product launch, and by the time it went live the feature had already been superseded. The lift was a modest 12 %, barely covering the production bill.
So why does the structured approach consistently outperform? Three reasons:
- KPI‑first mindset. Every second of footage is measured against a single business outcome – you never waste time on “nice‑to‑have” flourishes.
- Repeatable template. The hook‑problem‑solution‑CTA script cuts brainstorming by 70 % and ensures the hook lands in the first five seconds, the exact window where viewers decide to stay.
- Fast feedback loop. With a 48‑hour turnaround you can iterate on watch‑through and CTA click‑through rates while the campaign is still hot, keeping the cost per acquisition low.
If you’re wondering where to start, the first step is to audit your existing video assets. Tag every clip with a UTM that reflects its KPI, pull the data into your CRM, and calculate the incremental revenue versus the total spend. You’ll quickly see which approach is dragging your ROI down.
For SaaS founders looking for the next tool to tighten that loop, check out our Video Marketing Tools for SaaS Founders and Product Teams. It lists the platforms that integrate cleanly with your analytics stack and keep the data flow frictionless.
Bottom line: DIY can work for quick social updates, agencies shine for flagship campaigns, but the structured framework gives you the best of both worlds – a predictable, data‑driven ROI that scales with your sprint cadence.
FAQ
How do I actually calculate video marketing ROI for a SaaS landing page?
Start with the baseline conversion rate of the page before you add the video. Then run an A/B test – half the visitors see the page with the video, half see the original copy. After at least seven days, note the new conversion rate, subtract the baseline, and divide by the baseline to get the lift percentage. Multiply that lift by your average revenue per user (ARPU) and you have the incremental revenue. Finally, divide that revenue by the total spend on the video (production, editing, distribution) and multiply by 100 % – that’s your ROI. It sounds like a lot of steps, but a simple spreadsheet does the heavy lifting.
What specific metrics should I track to prove video marketing ROI?
The three must‑track numbers are watch‑through rate (how much of the video people actually see), CTA click‑through rate (how many viewers click the link or button you embed), and the downstream conversion tied to your KPI – sign‑ups, demo requests, or ticket reductions. Secondary signals like average view duration, social shares, and bounce rate help explain why the primary metrics move, but the ROI story lives in that lift‑plus‑revenue calculation.
Is there an ideal video length that maximizes ROI?
For most SaaS use‑cases, aim for 45‑seconds to a minute. The first five seconds are the make‑or‑break moment; if you hook a viewer there, you’ll see higher watch‑through and CTA clicks. Longer videos can work for deep‑dive demos, but they need a stronger reason to stay – otherwise watch‑through drops and ROI erodes. Test a 30‑second version first; if the lift is strong, you can iterate on length.
Can I test video marketing ROI without blowing my budget?
Absolutely. Use a DIY‑style shoot with a decent webcam and a lapel mic – the production cost can stay under $500. Pair that raw footage with a fast‑turnaround post‑production partner who adds captions and branding for a flat fee. The cheap test still gives you clean data, and because the cost base is low, even a modest 10 % lift translates into a healthy ROI.
How often should I refresh or replace videos to keep ROI strong?
Treat every video as a sprint rather than a one‑off. After the first test, monitor the key metrics for a month. If watch‑through falls below 50 % of the video length or CTA clicks dip by more than 2 % from the baseline, it’s time to tighten the hook or update the script. In practice, a quarterly refresh – new hook, refreshed graphics, or a tighter edit – keeps the content fresh and the ROI humming.
What common mistakes sabotage video marketing ROI?
We see three recurring pitfalls: (1) forgetting a single KPI – without a clear objective the video becomes decorative, not decisive; (2) over‑producing – fancy motion graphics add cost but rarely move the conversion needle; and (3) skipping the A/B test – launching a video without a control makes it impossible to attribute lift. Keep the focus narrow, the production lean, and the data rigorous, and the ROI will speak for itself.
Conclusion & Next Steps
We’ve walked through why a chaotic DIY shoot or a pricey agency retainer rarely pays off, and how a structured, KPI‑first framework turns every second of video into measurable growth.
So, what does that mean for you, the SaaS founder or product manager staring at a landing‑page that won’t convert? It means you can stop guessing and start testing, with a clear line‑item budget and a 48‑hour turnaround that keeps the funnel hot.
Key takeaways
- One KPI per video. Pick the metric that matters—sign‑up rate, ticket reduction, demo request—and let it drive the script, length, and CTA.
- Repeatable template. Hook‑problem‑solution‑CTA shaves brainstorming time by up to 70 % and guarantees the hook lands in the first five seconds.
- Fast feedback loop. Launch an A/B test, watch watch‑through and CTA clicks for a week, then iterate before the next sprint.
Ready to put this into motion? Pick the highest‑intent page in your product, write a 45‑second hook using the template, and upload the raw footage to a post‑production partner that charges a flat fee. Track the three core metrics, calculate the lift, and let the numbers tell you whether to double‑down.
And if you need a quick sanity check, our team at Forgeclips can help you set up the first test without the agency headache. The next sprint is yours—grab that data, prove the ROI, and keep the growth engine humming.