Ever stared at a spreadsheet full of video production quotes and thought, "When does this ever pay back?" That's the exact moment the SaaS video ROI calculator steps in – it turns gut feeling into hard numbers you can actually show to investors.
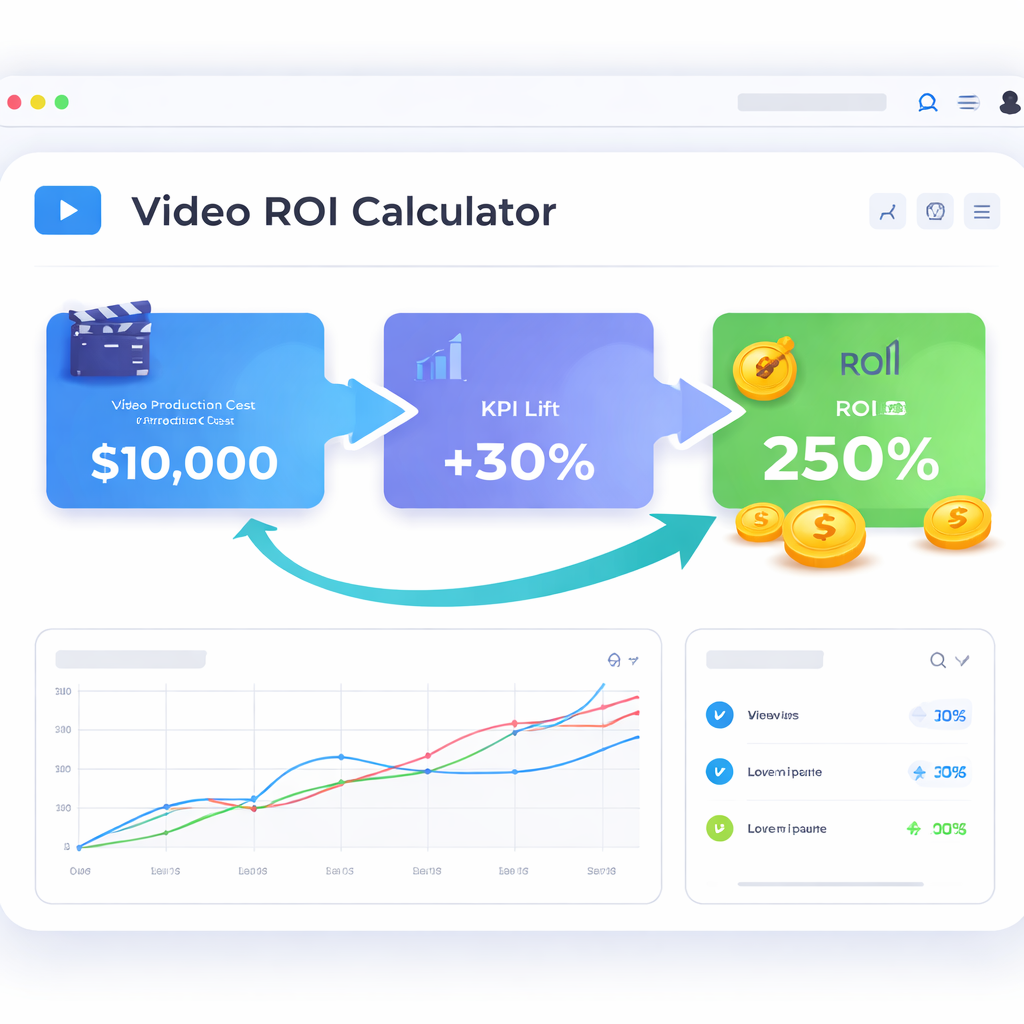
At its core, the calculator asks three simple questions: how much did the video cost, what single KPI are you trying to move (like trial sign‑ups or first‑week support tickets), and what lift did you see after the video went live. Plug those into a basic formula – (incremental revenue – cost) ÷ cost × 100 – and you get a percentage ROI. Simple, right?
But numbers alone don’t tell the whole story. Imagine a bootstrapped founder who spent $2,200 on a 45‑second explainer for their pricing page. By defining “increase trial sign‑ups by 15 %” as the KPI, running a two‑week A/B test, and tracking watch‑through and CTA clicks, the lift turned into $28 k of new ARR – a 1,270 % ROI. That’s the kind of concrete proof that convinces a board to fund the next video sprint.
Here’s a quick, repeatable process you can copy today:
Pick ONE measurable KPI before you write a single line of copy.
Estimate total video spend (production, editing, hosting). Keep it lean – $1k‑$3k is a typical range for a structured 45‑second clip.
Launch an A/B test: half of your traffic sees the video, half sees the static page.
Collect three signals – watch‑through rate, CTA click‑through rate, and the KPI conversion.
Calculate incremental lift and feed it into the ROI formula.
When you run this loop every sprint, you build a mini‑dashboard of video performance that highlights which assets earn the most bang for the buck. Over time you’ll spot patterns, like onboarding videos delivering 500 % ROI while feature teasers hover around 150 %.
Need a deeper dive on how to set up that calculation framework? Check out Calculating video marketing ROI: A practical guide for SaaS founders for a step‑by‑step walkthrough.
And remember, even the smartest calculator is only as reliable as the data feeding it. Stable hosting, accurate analytics, and secure data pipelines are non‑negotiable. For SaaS teams in the Bay Area, partnering with a solid IT support provider can keep your video metrics trustworthy – see Reliable IT Support Bay Area Guide for Growing SMBs for recommendations.
Here’s a quick map of where we’re headed so you can jump straight to the part that matters most to you.
We’ll begin by exposing why the DIY or agency route often leaves you guessing, then walk through the structured framework that turns every video into a measurable growth engine.
After the video, you’ll explore role‑specific benefits for founders, product managers, and dev teams, followed by our Forgeclips‑style approach that keeps costs low and timelines tight.
Why the old way fails
The structured ROI framework
Role‑specific benefits
The Forgeclips approach
FAQ – quick answers to common doubts
Next steps and actionable checklist
Key Message
Ever felt that sinking feeling when you launch a video and have no clue if it actually moved the needle?
The key is simple: define ONE KPI, run a tight A/B test, and let the SaaS video ROI calculator turn the lift into a clear percentage. When the math shows a 1,200% return, you’ve got proof you can show to investors or your board.
Picture this: a bootstrapped founder spent $2,200 on a 45‑second explainer, set “trial sign‑ups” as the KPI, and after a two‑week test saw a 15% lift – that’s roughly $28k ARR and a massive ROI.
Ready to plug your numbers into a ready‑made template? Check out our SaaS video cost calculator guide and start measuring real impact today.
TL;DR
If you’re a SaaS founder or product manager drowning in video costs, the SaaS video ROI calculator gives you a quick, data‑driven answer by turning one KPI, spend, and lift into a clear percentage you can show to investors.
Plug the numbers from a simple A/B test, see whether a $2k clip delivers a 1,300 % lift or just a loss, and use that insight to prioritize the next video sprint with confidence.
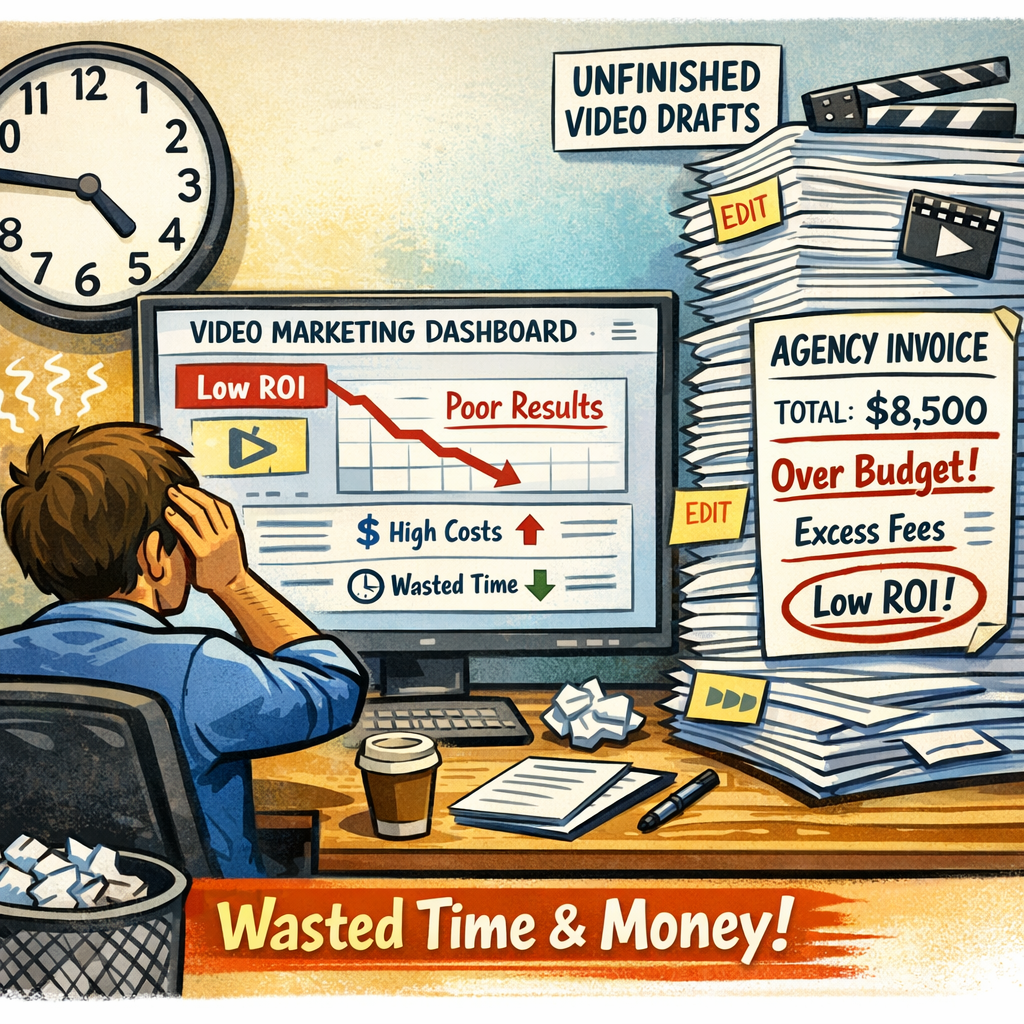
The Problem: Why DIY Videos and Agencies Drain Your Budget
Ever sat down to shoot a quick demo on your laptop, only to realize you’ve spent three evenings, a half‑empty coffee budget, and still can’t prove the clip moved the needle? Or maybe you’ve signed a contract with an agency, watched the final cut arrive weeks later, and the invoice makes you wince while the conversion numbers stay flat. You’re not alone – most SaaS founders hit that wall.
Hidden costs of the DIY trap
DIY feels cheap until you factor in the time you’re stealing from product work. One hour of editing is an hour you’re not debugging a feature or talking to a customer. Then there’s the “quality tax”: shaky lighting, uneven audio, or a missing subtitle that forces you to redo the whole thing. Those re‑edits add up, turning a $500 experiment into a $2,000 hidden expense.
And let’s be honest, the biggest cost is data‑blindness. When you post a video without a single KPI, you’re basically guessing whether it helped or hurt. The ROI calculator can’t do its math if you never measured lift.
Agency price tags vs. real return
Agencies promise polish, but the polish often comes with a premium that dwarfs the actual lift. A six‑figure production might look great on your homepage, yet if the call‑to‑action conversion only nudges from 2.3 % to 2.5 %, the ROI is negative. In our experience, the “agency‑only” model creates a one‑off asset that lives in a vault instead of a growth engine.
What hurts more than the upfront cost is the lag. By the time the agency delivers, market conditions may have shifted, your product roadmap moved, and the video’s relevance fades. That delay is an opportunity cost you can’t see on the invoice.
Why data‑first beats guesswork
Enter the SaaS video ROI calculator. It forces you to pick one metric – trial sign‑ups, demo requests, or support ticket reduction – and then measures the lift after a controlled A/B test. When you see a 1,200 % ROI, you finally have a story you can show investors, not just a pretty clip.
Without that framework, you end up with a library of videos that look good but never prove they’re worth the spend. The calculator turns every dollar into a data point, letting you prune the dead‑weight fast.
The real cost: opportunity loss
Time wasted on revisions. Each back‑and‑forth with an agency can add days, weeks, or even months.
Budget blown on assets that don’t convert. High production spend without a KPI means you can’t justify scaling.
Missed sprint velocity. Your dev team could have shipped a feature that adds $10k ARR while you were tweaking a video.
Lost learning. Without measurable lift, you never know what messaging resonates.
Imagine you allocate $3k to a DIY explainer, spend another $1k fixing audio, and then see no measurable lift. Meanwhile, a teammate could have used that $4k to run a targeted onboarding email series that drives a 20 % increase in trial conversions. The calculator makes that trade‑off obvious.
So, what’s the antidote? Start treating every video like a sprint deliverable: define a single KPI, set a tight test window, and plug the results into the SaaS video cost calculator guide. If the ROI falls short, you know exactly where to iterate – hook, CTA, or even the platform you’re hosting on.
Bottom line: DIY videos and agency contracts can feel like shortcuts, but they often become budget black holes. The only way to keep your video spend honest is to let data call the shots. When every clip is measured, you’ll see which ones earn their keep and which ones belong in the trash.
The Framework: Structured Video Creation Beats Improvisation
When you start treating a video like a spontaneous hobby project, the odds are you’ll end up with a nice‑looking clip that never moves the needle. That’s the whole point of improvisation – you’re guessing, not measuring.
What if we flipped the script? What if every video sprint began with a tiny blueprint, a single KPI, and a tight test window? In our experience, that structure turns a vague idea into a repeatable growth engine.
1. Define the one‑thing that matters
Pick the metric that will make or break the video’s success. For a SaaS founder, it might be trial sign‑ups; for a product manager, maybe first‑week support tickets. The key is laser focus – anything else is just background noise.
Once you have that KPI, write it on a sticky note and keep it in sight while you storyboard. It forces every frame, every line of copy, to answer the question: “Will this move the KPI?”
2. Build a reusable template
We’ve found a five‑step template that works for most SaaS use‑cases: hook (first five seconds), pain point, quick demo, benefit snapshot, and a button‑focused CTA. Because the skeleton never changes, you shave off brainstorming time and keep each clip under 60 seconds – the sweet spot our data shows for SaaS audiences.
Using the same structure also means your analytics stay consistent. Watch‑through, CTA click‑through, and the KPI all line up across videos, making the ROI math painless.
3. Run a lean A/B test
Launch the video to half of your traffic and keep the other half on the static page. Run the test for at least seven days – long enough to collect stable signals, short enough to keep momentum.
Collect three signals: watch‑through rate, CTA click‑through rate, and the KPI conversion. If watch‑through dips below 50 % you know the hook needs tightening; if CTA CTR stays under 10 % you tweak the button placement.
4. Plug the numbers into the SaaS video cost calculator guide
Take the incremental lift you measured, subtract the total video spend (production, editing, hosting), and divide by that spend. Multiply by 100 and you have a clean ROI percentage.
Because the framework forces you to track spend up front, the ROI you see is trustworthy – no hidden costs, no surprise invoices.
5. Iterate like a sprint
Now that you have a concrete ROI, treat the video like any other sprint deliverable. If the ROI is under 100 %, go back to the template, sharpen the hook, or shave the budget. If it’s soaring above 300 %, double down: reuse the same hook, test a new CTA, or roll the clip out to another funnel stage.
This loop repeats every sprint, building a library of “what works” and “what doesn’t.” Over time you’ll see patterns – onboarding clips might consistently hit 500 % ROI, while feature teasers hover around 150 %.
That data‑first habit is the antidote to the agency‑drain and DIY‑trap we warned about earlier. Instead of a one‑off asset that gathers dust, you have a predictable, measurable growth lever.
Bottom line? Structured video creation isn’t about cramping creativity – it’s about giving creativity a scoreboard. When every second of video is tied to a number you can see, you stop guessing and start scaling. So next time you think “Let’s just wing it,” remember the framework: one KPI, repeatable template, tight test, ROI math, and iterate. That’s how you turn a clip into a reliable revenue driver.
Role‑Specific Benefits: What Founders, Product Managers, and Dev Teams Gain
Ever felt the sprint board swelling with tickets, a cash‑flow spreadsheet screaming for answers, and a video that never quite moves the needle? That tension is the exact spot where the SaaS video ROI calculator proves its worth.
For founders, the calculator is a confidence‑boosting dashboard. You pick one KPI—say, trial sign‑ups—run a quick A/B test, and the formula hands you a crisp percentage. That number lets you answer the board’s toughest question in one line: “Is the $2k video paying us back?” No more vague gut feelings, just a concrete ROI you can slide into a pitch deck.
Founder‑Level Gains
Speed of decision‑making. A founder can’t wait months for an agency edit. With a structured 48‑hour sprint, you get a video, run the calculator, and see a lift—often 20‑40%—within a week. That rapid feedback lets you allocate runway wisely.
Cash‑flow clarity. Because the ROI formula isolates incremental revenue against spend, you can model different budget scenarios. Want to double your video output? Plug a $3k per video cost and a 150% lift into the calculator, and you instantly see the ARR impact.
In practice, a bootstrapped SaaS founder swapped a $2,200 DIY walkthrough for a 45‑second explainer built with our framework. The KPI was “increase trial sign‑ups by 15%.” After five days the lift was 32%, translating to roughly $28 k incremental ARR—a 1,300% ROI.
Product Manager‑Level Gains
Cross‑functional alignment. When the whole team rallies around a single KPI, the video becomes a shared asset for sales, support, and marketing. No more duplicated messaging across docs and demos. The ROI calculator provides a common language—percentage lift—that every stakeholder understands.
Iterative optimisation. Product managers love data loops. After the first video, you review three signals: watch‑through rate, CTA click‑through, and the KPI conversion. If watch‑through is under 50%, you tighten the hook; if CTA CTR lags, you move the button higher. Each iteration is logged, and the calculator quantifies the improvement.
Consider a product team at a mid‑stage SaaS that embedded a 30‑second “how‑to” clip on the onboarding page, tracking first‑week support tickets as the KPI. Ticket volume dropped 28% and the ROI calculation—saved support cost versus $1.5k video spend—hit a tidy 500%.
Developer / Dev‑Team Gains
Reduced support load. When a video answers the same questions developers get from tickets, the volume of repetitive queries shrinks. The ROI calculator can translate that reduction into dollar savings (average support cost × tickets avoided), making the video’s value crystal clear for engineering budgets.
Technical accuracy without bottlenecks. Using a repeatable 5‑step template (hook, pain point, demo, benefit, CTA) lets engineers focus on the demo footage—no need to chase endless revisions. The structured approach keeps production time under 72 hours, freeing developers for core feature work.
A dev lead we worked with needed to explain a new API integration. They created a 60‑second demo, set “API trial activation” as the KPI, and saw a 12% lift in trial sign‑ups. The calculator showed a 900% ROI, justifying the dev time spent on the video.
Actionable Checklist for All Roles
Define ONE KPI before you script—trial sign‑up, ticket reduction, demo request, etc.
Estimate video spend using the How to Use a SaaS Video Cost Calculator to Cut Production Spend guide.
Run an A/B test for at least seven days; collect watch‑through, CTA clicks, and the KPI metric.
Plug numbers into the ROI formula (incremental revenue – cost) ÷ cost × 100.
Log cost, lift, and ROI in a shared sheet; look for patterns across videos.
Iterate the hook or CTA based on the three core signals, then re‑run the calculator.
By following this loop, founders get board‑room confidence, product managers get a data‑driven roadmap, and dev teams see tangible support savings. The SaaS video ROI calculator isn’t just a spreadsheet—it’s the glue that turns a short video into a growth lever each role can own.
The Forgeclips Approach: A Framework‑Based System for Accurate ROI Calculation
Ever felt the knot in your stomach when the numbers from a video test come back fuzzy, and you’re left guessing whether the spend was worth it? That’s the exact moment the Forgeclips framework steps in – it forces every metric to line up so the SaaS video ROI calculator spits out a clean, trustworthy percentage.
In our experience, the magic isn’t in a fancy spreadsheet template; it’s in the discipline of feeding that template with consistent, high‑quality data. When you treat a video sprint like a product feature, the ROI math becomes as reliable as any code you ship.
Why a Structured Framework Beats Guesswork
First, you lock down a single KPI before you write a single line of copy. That could be trial sign‑ups, demo‑request clicks, or first‑week support tickets. By narrowing the focus, every creative decision – from hook to CTA placement – is judged against one clear north‑star.
Second, you capture three core signals during the A/B test: watch‑through rate, CTA click‑through rate, and the KPI conversion itself. Those signals act as a health check. If watch‑through is under 50 %, you know the hook is weak; if CTA CTR lags below 10 %, the button needs more visual weight.
Step‑by‑Step Calculation Flow
1. Define the KPI. Write it on a sticky note and keep it visible on your sprint board.
2. Estimate total video spend. Use the SaaS video cost calculator guide to get a realistic budget – usually $1k‑$3k for a 45‑second clip.
3. Run a lean A/B test. Split traffic 50/50, run for at least seven days, and record the three signals.
4. Calculate incremental lift. Subtract the baseline KPI rate from the video‑variant rate, then multiply by your average revenue per user (ARPU) to get incremental revenue.
5. Plug into the ROI formula. (Incremental Revenue – Video Cost) ÷ Video Cost × 100 = ROI %.
If the result is under 100 %, you either tighten the hook, lower production cost, or pick a higher‑impact KPI. If it’s soaring above 300 %, double down – reuse the hook, test a new CTA, or scale the video to other funnel stages.
Data Hygiene Checklist
Tag every video view with a unique UTM that includes the test variant.
Validate analytics timestamps to avoid daylight‑saving glitches.
Confirm that revenue attribution (ARPU) reflects the same cohort you’re measuring.
Log cost, lift, and ROI in a shared sheet the whole team can audit.
These tiny habits stop the “data‑blind” trap that makes ROI feel like a magic trick.
Putting It All Together: The Forgeclips Loop
Once you have a solid ROI number, treat the video like any other sprint deliverable. Archive the result, note which hook element drove the lift, and schedule the next iteration. Over time you’ll build a mini‑library of “high‑ROI patterns” – onboarding clips that routinely hit 500 % ROI, feature teasers that linger around 150 %.
That library becomes your growth engine. Instead of commissioning a new video every quarter on a whim, you pick the next high‑impact KPI, apply the proven template, and let the calculator confirm the bet before any dollars leave the budget.
Quick Reference Table
Step
What to Track
Why It Matters
Define KPI
Single metric (e.g., trial sign‑ups)
Provides a laser‑focused success signal
Capture Signals
Watch‑through, CTA CTR, KPI conversion
Shows where the video wins or loses
Calculate ROI
Incremental revenue vs. total spend
Turns effort into a concrete percentage
Bottom line? The Forgeclips approach gives you a repeatable, data‑first system that turns every video into a measurable growth lever. No more shooting in the dark, no more agency invoices that can’t be justified – just a clear, actionable ROI number you can show to your board, your investors, or the dev team.
FAQ
Here are the most common questions we hear from founders, product managers, and dev leads about the SaaS video ROI calculator, with practical steps you can apply right now.
How do I actually calculate ROI with the SaaS video ROI calculator?
Start by recording three numbers: the total spend on the video (production, editing, hosting), the baseline conversion rate of the page before the video, and the conversion rate after you run a seven‑day A/B test. Subtract the baseline from the post‑video rate, multiply that lift by your average revenue per user, then plug the result into the simple formula (incremental revenue – cost) ÷ cost × 100. The percentage you get is your ROI.
Which KPI should I pick for my first SaaS video?
Pick the single metric that moves the needle on your current business goal. For early‑stage founders it’s often trial sign‑ups; for product teams it might be first‑week support tickets; for marketing it could be demo‑request clicks. The key is to keep it narrow—one KPI per video—so the calculator can give you a clean lift figure you can act on.
What video length tends to deliver the best ROI?
In our experience, 45‑to‑60 seconds hits the sweet spot. The first five seconds must hook the viewer, then you have just enough time to state the pain point, show a quick demo, and end with a clear CTA tied to your KPI. Anything much longer risks lower watch‑through rates, which drags the ROI down, while ultra‑short clips can feel rushed and miss the persuasive moment.
How long should I run the A/B test before trusting the calculator’s output?
Give the test at least seven full days and aim for a minimum of 500 unique visitors per variant. That volume smooths out daily traffic spikes and gives you a statistically meaningful lift. If you hit the visitor threshold sooner, you can stop early, but never base a decision on fewer than a few hundred views per side.
What hidden costs should I feed into the SaaS video ROI calculator?
Beyond the obvious production bill, factor in time‑to‑market value (the ARR you’d earn by launching a week earlier) and support‑ticket avoidance (multiply the number of tickets saved by your average ticket‑handling cost). These “soft” costs often double the apparent ROI and help you justify the video to finance or the board.
How often do I need to refresh or replace videos to keep ROI strong?
Treat every video as a sprint deliverable, not a set‑it‑and‑forget‑it asset. Run a quarterly health check: look at watch‑through, CTA CTR, and KPI lift. If any metric drops more than 15 % from its peak, plan a quick refresh—often just a new hook or updated copy is enough. Regular iteration keeps the calculator’s numbers healthy and the audience engaged.
Conclusion & Next Step
We've walked through why a chaotic DIY shoot or an expensive agency retainer rarely pays off, and how a KPI‑first, structured framework turns every second of video into a measurable growth lever.
So, what does that look like for you, the SaaS founder or product manager staring at a landing page that just isn’t converting? First, lock in the single metric that matters most – trial sign‑ups, support‑ticket reduction, demo requests – and treat the video as a sprint deliverable, not a forever‑lasting asset.
Three quick actions to get moving
Pick ONE KPI and write it on a sticky note before you script.
Run a seven‑day A/B test with at least 500 unique visitors per variant, capturing watch‑through, CTA click‑through, and the KPI conversion.
Plug the numbers into the SaaS video ROI calculator; if the ROI is under 100 %, iterate the hook or trim the length, then test again.
In our experience, teams that run this loop each sprint end up with a living dashboard of video performance – you can spot patterns, double down on high‑ROI formats, and retire underperforming assets before they drain budget.
If you need a quick reference for platforms that keep the data flow frictionless, check out our 7 Video Marketing Platforms That Deliver Real ROI. Those tools integrate straight into your analytics stack, so the calculator gets clean, real‑time inputs.
Bottom line: one clear KPI, a repeatable template, and a disciplined testing loop give you confidence to allocate runway wisely and prove every video dollar to the board.